
Custom R Component - Appstam Simple Confusion Matrix
Introduction
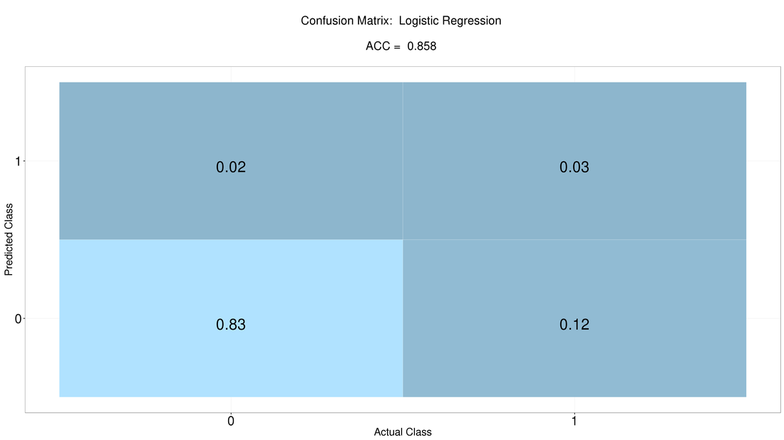
The extension Appstam Simple Confusion Matrix allows to plot confusion matrices if you are connected to an R server, without installing any R packages. In classification, a confusion matrix or error matrix visualizes the performance of an algorithm. Each row represents the relative frequencies of the predicted class and each column the frequencies of the actual class. Additionally, the extension provides heat map functionality, labelling and saving capabilities as well as an accuracy measure (ACC).
How to upload the component in SAP Predictive Analytics
The component can be downloaded as .spar file from GitHub. Then deploy it as described here. You just need to import it through the option "Import/Model Component", which you will find by clicking on the plus-sign at the bottom of the list of the available algorithms.
Extension Features
The extension has 4 main features:
The extension has 4 main features:
- Create Confusion Matrix: Create confusion matrices to compare actual and predicted classes for two classes
- Heat Map: Quadrants are colored according to the magnitude of the distribution. This allows two quickly identify peculiarities
- Annotations: Customize your plots by integrating the name of the model used to produce the predictions
- Save your plot: Save your plot as png or jpg file
Usage
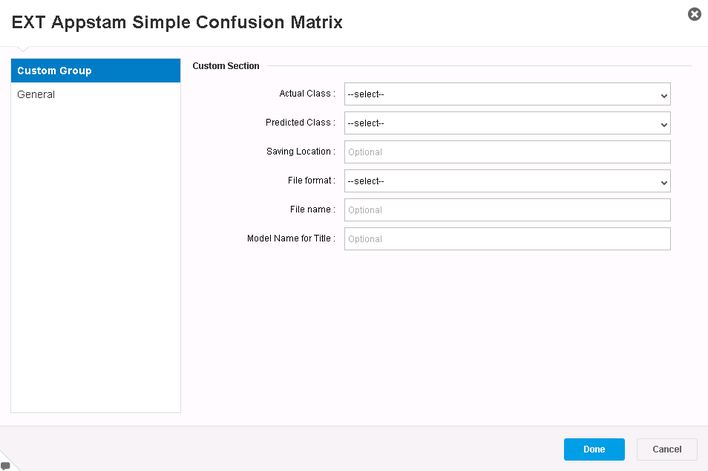
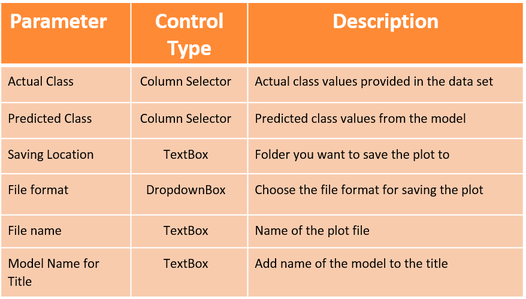
These parameters can be set by the user:
These parameters can be set by the user:
Disclaimer
Please note that this component is provided as-is without any guarantee or support. Please test the component to ensure it works for your purposes. The R code and the GPL3 license can be found in the package R_appstamFE (Appstam Front End).
Please note that this component is provided as-is without any guarantee or support. Please test the component to ensure it works for your purposes. The R code and the GPL3 license can be found in the package R_appstamFE (Appstam Front End).
Contact
If you have any suggestions or are interested in a customized version that suits your requirements, feel free to contact us under info@appstam.com. Thank you for your feedback.
If you have any suggestions or are interested in a customized version that suits your requirements, feel free to contact us under info@appstam.com. Thank you for your feedback.
